What’s driving Australian Commercial Property growth in 2026
Australia’s commercial property market entering 2026 is no longer defined by a single cycle. Instead, performance is fragmenting by sector, asset quality, and micro-location. The next phase will reward investors who understand where fundamentals are genuinely improving – and where pricing already reflects optimism.
Industrial & Logistics: Still the Strongest – but No Longer Cheap
Industrial and logistics assets remain the most resilient commercial sector, supported by structural demand rather than cyclical recovery.
What’s actually driving demand
- E-commerce penetration continues to grow (now ~18–20% of retail sales nationally)
- Supply chain re-shoring and last-mile logistics
- Data centres, cold storage, and automated warehousing requirements
If you’re buying a home, making that decision without an independent, objective view is a risk many buyer’s underestimate. efore you make an offer, order PropCred Home Buyers Report (for only $39) to get an independent analysis of your property purchase. Our property analysts with extensive industry experience provide professional insight specific to your property purchase.
The professional investment deck prepared by our analyst team includes price guidance, rental returns, growth potential, and clear buy–or–don’t-buy recommendations, with the reasoning laid out behind the numbers.Reports are typically delivered within one hour.
Where demand is strongest (examples)
- Sydney: Eastern Creek, Erskine Park, Alexandria
- Melbourne: Truganina, Derrimut, Laverton North
- Brisbane: Yatala, Wacol, Berrinba
The numbers that matter
- Vacancy rates in prime infill locations: <1.5%
- Prime industrial cap rates (2025): 4.75–5.25%
- Typical rental growth (2024–25): 4–7% p.a., slowing from prior years
Research from Cushman & Wakefield and CBRE shows demand remains strong, but pricing is now tight.
Key correction:
Industrial is low-risk, not high-upside from here. Much of the growth story is already priced in. Future returns will skew toward income stability, not outsized capital gains.
Retail Property: A Selective Recovery, Not a Broad Comeback
Retail’s improvement is real – but limited to specific formats and catchments.
What’s working
- Neighbourhood and sub-regional centres anchored by:
- Supermarkets
- Medical and allied health
- Services (childcare, gyms, government)
- Large-format retail (Bunnings, JB Hi-Fi Homemaker-style precincts)
What’s not
- Fashion-heavy discretionary malls
- Older centres in weak income-growth suburbs
- Assets requiring constant incentives to retain tenants
Indicative performance
| Retail Format | Cap Rates (Prime) | Vacancy |
| Neighbourhood centres | 5.75–6.25% | 2–4% |
| Large-format retail | 6.25–6.75% | 3–5% |
| Secondary malls | 7.5%+ | 8–12% |
Recent transactions tracked by Savills show yield compression only in dominant assets with strong household incomes and limited competition.
Thinking of buying property? Get expert analysis before you commit—delivered in just 1 hour for $39.
Key correction:
Retail is not “back” – defensive retail is back. Everything else remains structurally challenged.
Office: Quality Matters More Than Location Alone
Office markets are now defined by asset relevance, not CBD postcodes.
Where demand is stabilising
- Sydney: Barangaroo, Martin Place, Circular Quay
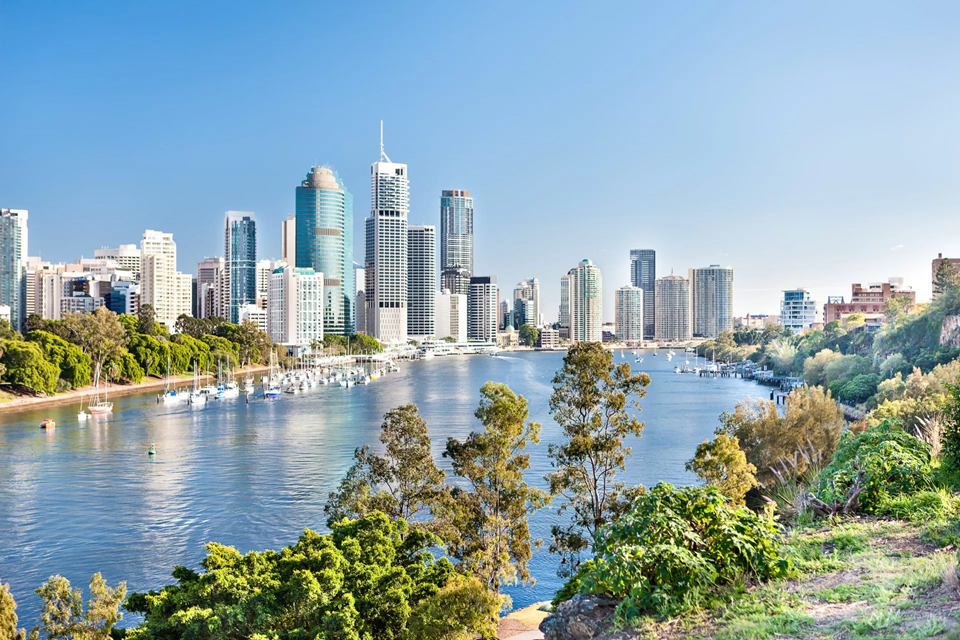
- Brisbane: CBD core, Premium-grade riverfront assets
- Tenant preference: fewer offices, higher quality, ESG-aligned
Where risk remains
- B- and C-grade buildings
- Fringe CBDs with limited amenity
- Assets built pre-2000 without upgrade paths
Current indicators
- Premium office vacancy (Sydney/Brisbane): 8–10%
- Secondary office vacancy: 15–25%
- Effective rents often flat to negative once incentives are included
CBRE and Property Council data show the market has become two-speed – with conversion or repositioning often the only viable path for secondary stock.
Key correction:
This is not a cyclical downturn – it’s a structural reset for office.
Cap Rates: Compression Is Possible, Not Guaranteed
The original article assumes cap rate compression as a base case. A more realistic view is scenario-based.
Likely outcomes
- Prime industrial & retail: stable to modest compression (25–50bps)
- Secondary assets: flat or expanding
- Office: polarised by grade
Cap rates peaked in 2024–25, but future movement depends on:
- Inflation persistence
- Timing of rate cuts
- Offshore capital selectivity
Compression will be earned, not automatic.
Make an informed offer. Professional property analysis in 1 hour.
What This Means for Investors in 2026
The commercial market is no longer forgiving.
Likely outperformers
- Prime industrial in land-constrained suburbs
- Neighbourhood retail with essential-service tenants
- Premium-grade, ESG-compliant office
Likely underperformers
- Secondary office without conversion pathways
- Discretionary retail in average-income catchments
- Overpaid industrial assets with short WALEs
Final Takeaway
Australia’s commercial property market in 2026 is not about riding a cycle – it’s about asset selection, micro-location, and realism on pricing.
The winners won’t be those who follow headlines, but those who:
- Distinguish risk-adjusted returns from narrative strength
- Separate structural demand from crowded trades
Accept that “defensive” doesn’t always mean “cheap”
Leave a Reply